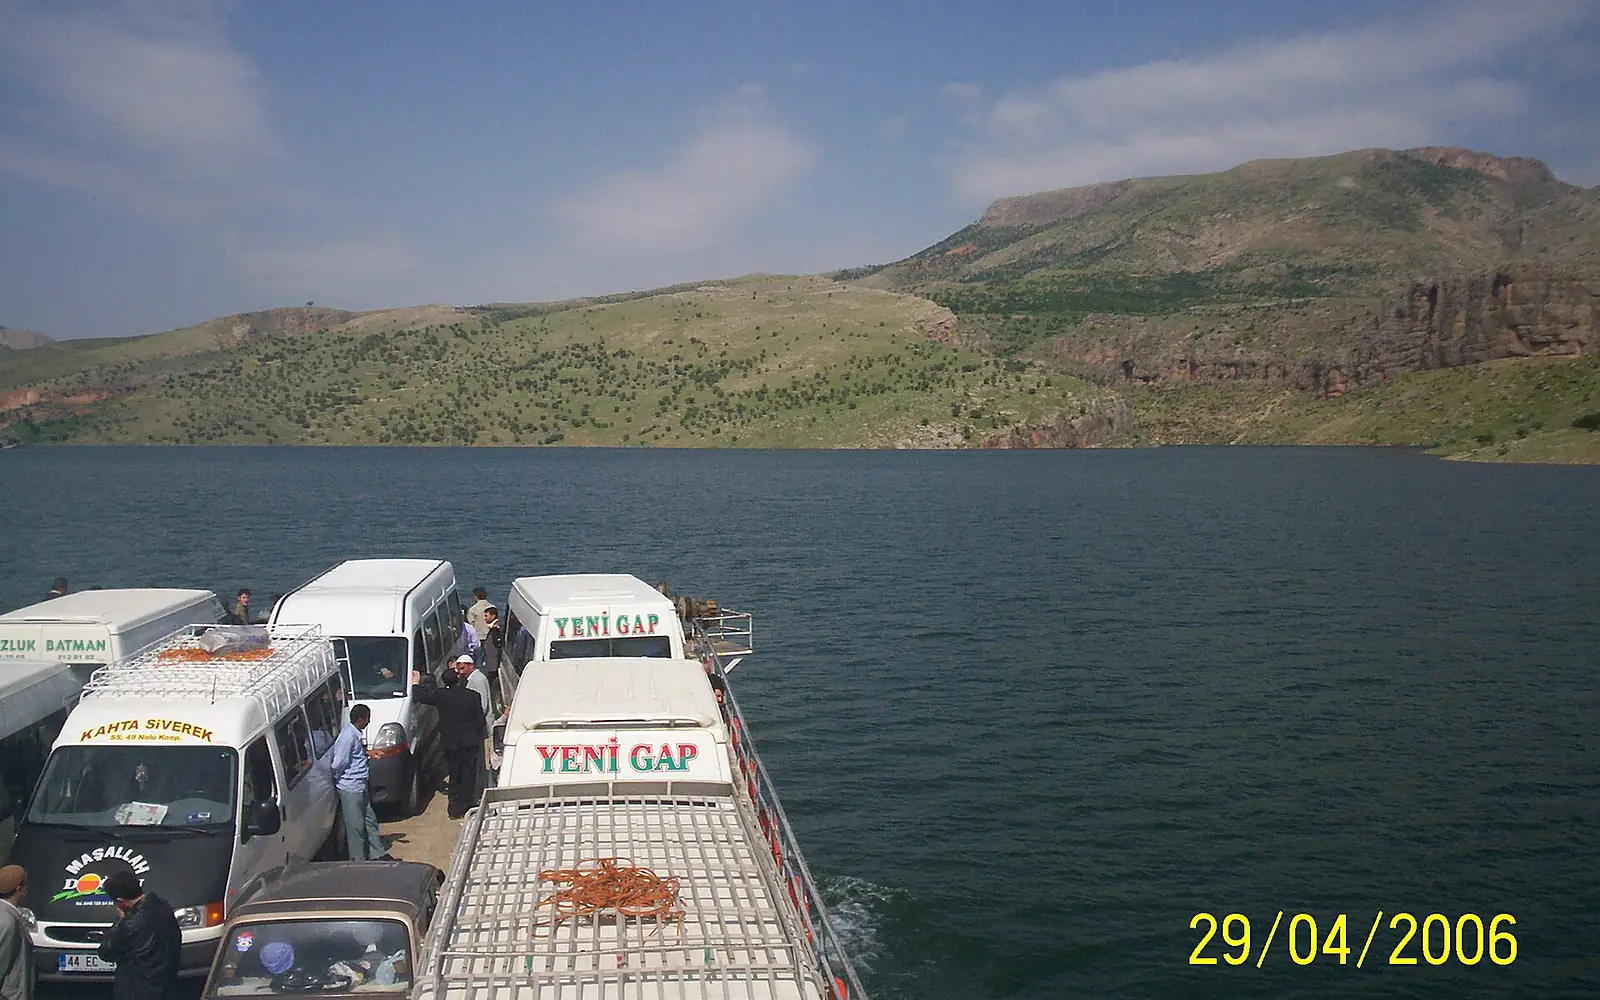
 Reservoir · Turkey
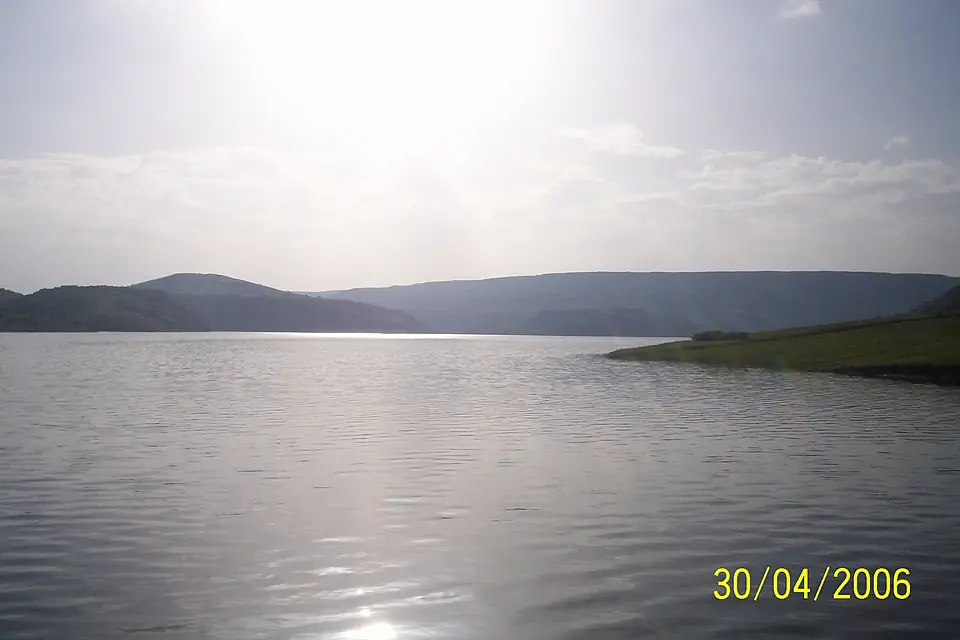
Atatürk Reservoir
Reservoir in Turkey
- Area
- 695km²
- Average depth
- 70m
- Elevation
- 530m a.s.l.
- Shoreline
- 1,461km
- Volume
- 48.7km³
Atatürk Reservoir is a reservoir in Turkey. It covers 695 km². On average it is 70 m deep. Its surface lies 530 m above sea level.
Plan your visit
Stay, sail and get there
Some links above are affiliate links: if you book through them we may earn a commission, at no extra cost to you. It never changes what the data on this page says.
The water
How warm is Atatürk Reservoir?
The water is warmest in August, around 28 °C at the surface, and coldest in February, around 9 °C. The surface averages 20 °C or more from June to October: comfortable for most swimmers.
It does not normally freeze in winter.
On the shore, afternoons reach 40 °C on average in July and 8 °C in January. The driest month is August (1 mm of rain), the wettest December (72 mm).
Average surface temperature measured by the Landsat 8 satellite between 2013 and 2021 at the point furthest from the shore (118 readings). Shallow bays and beaches are often warmer.
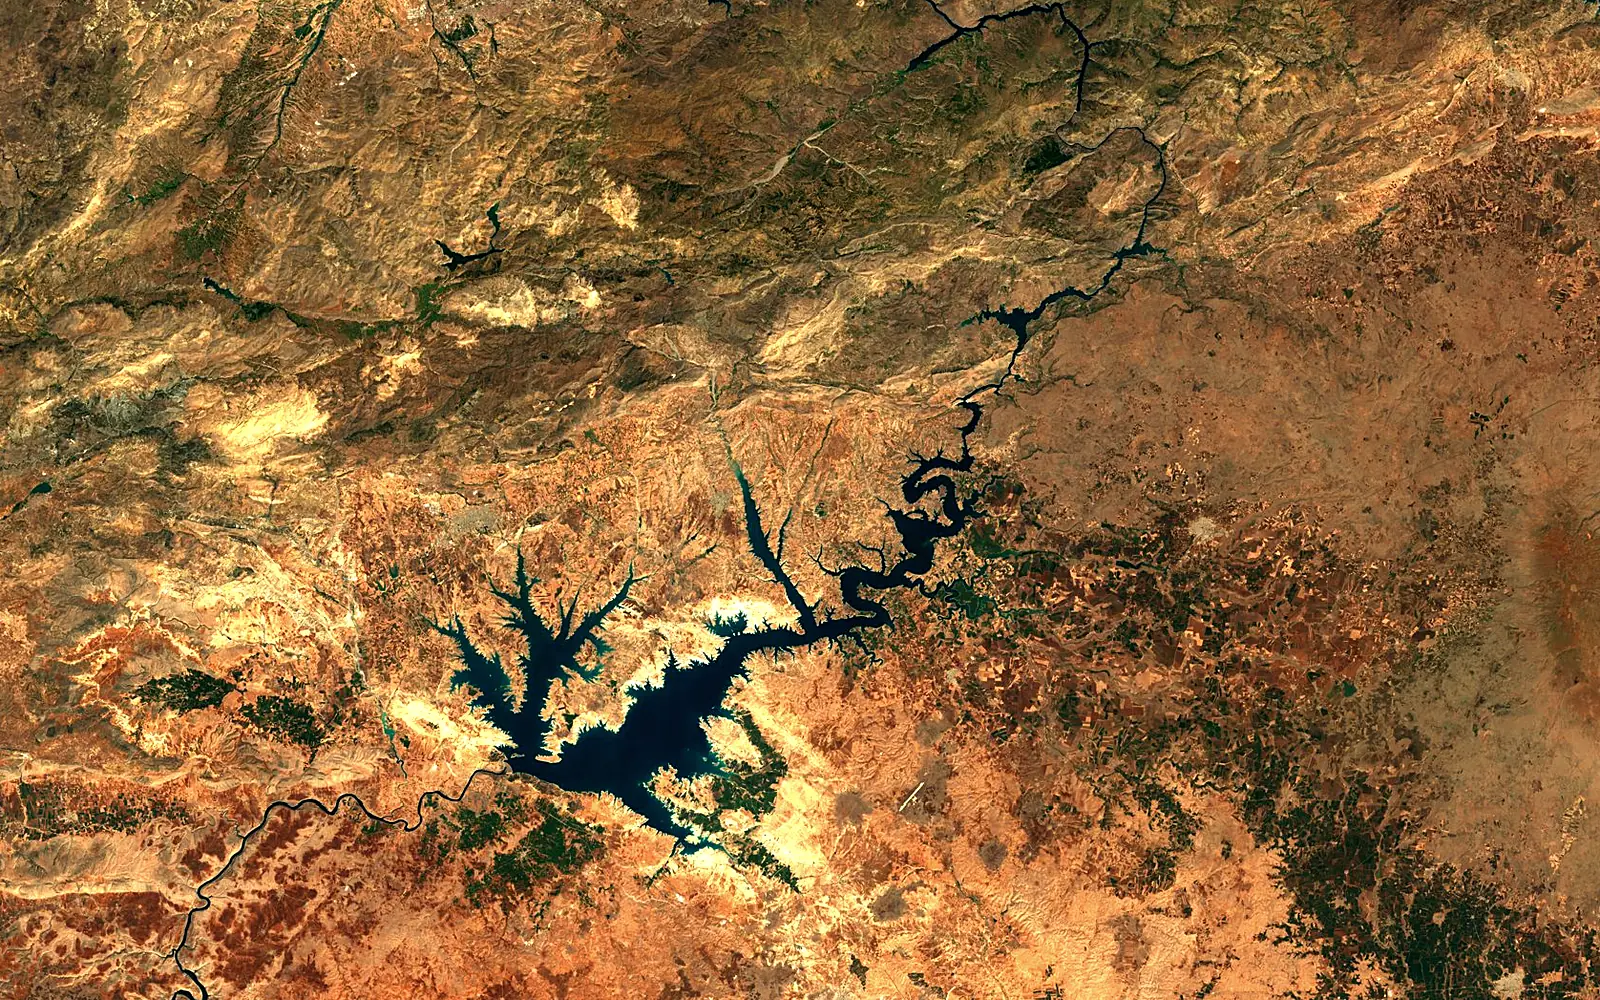
From above
The whole lake from space
Month by month
The year at the lake, month by month
Not a forecast: these are averages over many years. Water is the 2013–2021 average; air, rain, sun and wind are the 1991–2020 average.
Water: 2013–2021 averageClimate: 1991–2020 average
| Month | Water°C | Water high°C | Air high°C | Air low°C | Rainmm | Rainy daysdays | Sunh/day | Windkm/h |
|---|---|---|---|---|---|---|---|---|
| January | 9 | 10 | 8 | -1 | 70 | 10 | 3.9 | 13 |
| February | 9 | 10 | 10 | 0 | 61 | 10 | 4.6 | 12 |
| March | 11 | 12 | 16 | 4 | 50 | 9 | 6.8 | 12 |
| April | 14 | 17 | 21 | 8 | 49 | 9 | 8.3 | 11 |
| May | 19 | 22 | 28 | 14 | 29 | 6 | 10.2 | 12 |
| June | 24 | 26 | 35 | 20 | 7 | 2 | 12.9 | 15 |
| July | 27 | 28 | 40 | 24 | 1 | 0 | 13.0 | 15 |
| August | 28 | 28 | 40 | 24 | 1 | 0 | 11.8 | 14 |
| September | 25 | 27 | 34 | 19 | 7 | 1 | 10.3 | 13 |
| October | 21 | 23 | 26 | 14 | 32 | 6 | 7.5 | 11 |
| November | 16 | 18 | 17 | 5 | 49 | 7 | 5.9 | 11 |
| December | 12 | 14 | 10 | 0 | 72 | 10 | 4.3 | 13 |
Water: LakeTEMP (Landsat 8, 2013–2021). Air, rain, sun and wind: NASA POWER, 1991–2020 averages. A rainy day has at least 1 mm of rain. Sunshine hours are derived from measured solar radiation.
Size & depth
How big, how deep
- On average, water stays in the lake for about 2.2 years before flowing out.
- Its catchment drains 91,565 km² of land.
- About 702 m³ of water flow out every second, on average.
- Its shoreline is 15.6 times longer than a circle of the same area: plenty of bays and inlets.
Around the shore
What's around Atatürk Reservoir
Counted within 1.5 km of the shoreline in OpenStreetMap, the map anyone can edit.
- 1beaches and swimming spots
yüzen havuz
- 2campsites
Nissibi Köprüsü Karavan Kamp Alanı
- —boat hire and water-sport clubs
- —marinas and slipways
- 4ferry piers
- 4viewpoints
Atatürk Barajı Seyir Terası, Euphrates Cliffs
- —hotels, B&Bs and chalets
- —fishing spots
- 9restaurants and cafés
Towns on the shore
- Kâhta97,875 people
- Samsat9,308 people
- Gerger2,800 people
- Bağpınar73 people
- Taraksu
- Çaylarbaşı
- Akpınar
Nearest airport with scheduled flights: Adıyaman Airport (ADF), 24 km in a straight line.
Car hire at GZT airport (Gaziantep)Discover Cars · Affiliate linkOpenStreetMap is built by volunteers: when a number is low, it may just mean nobody has mapped it yet.
Recent years
How each month compared
Afternoon high on the shore. The first row is the reference, the 1991–2020 average in °C; the years below show the difference from it: warmer in orange, cooler in blue.
| Jan | Feb | Mar | Apr | May | Jun | Jul | Aug | Sep | Oct | Nov | Dec | |
|---|---|---|---|---|---|---|---|---|---|---|---|---|
| 1991–2020 average | 7.8 | 10.4 | 15.7 | 21.2 | 27.8 | 35.4 | 39.9 | 39.5 | 33.9 | 26.1 | 16.7 | 10.0 |
| 2020 | −0.1 | −2.2 | +0.1 | −1.8 | −1.3 | −1.2 | +1.3 | −0.3 | +3.6 | +3.6 | ±0.0 | +1.6 |
| 2021 | +2.0 | +2.2 | −0.8 | +2.7 | +5.2 | +0.6 | +1.0 | +0.4 | −0.6 | +0.7 | +2.1 | +0.7 |
| 2022 | −2.3 | +2.2 | −4.4 | +3.5 | −0.9 | +0.7 | +0.8 | +1.3 | +2.0 | +1.9 | +0.8 | +3.0 |
| 2023 | +2.6 | −1.4 | +0.9 | −1.6 | −1.0 | −0.5 | +1.3 | +2.5 | +2.3 | +1.7 | +2.3 | +3.0 |
| 2024 | +2.0 | +2.1 | ±0.0 | +3.9 | −0.9 | +4.8 | +1.5 | +1.9 | +0.6 | +1.0 | +0.6 | +0.9 |
| 2025 | +4.2 | −1.0 | +4.2 | +1.5 | +3.2 | +2.6 | +2.5 | +1.9 | +0.9 | +0.7 | +3.8 | +1.7 |
+1 warmer than usual −1 cooler than usual
 Syria
SyriaAbout these numbers
| Outline, area, depth, volume | HydroLAKES v1.0 (Messager et al. 2016) · CC BY 4.0 |
|---|---|
| Water temperature and ice | LakeTEMP v1 (Korver et al. 2024), Landsat 8 2013–2021 · CC BY 4.0 |
| Air, rain, sun, wind | NASA POWER, 1991–2020 · public domain |
| Names and description | Wikidata (Q34876740) · CC0 |
| Around the shore | © OpenStreetMap contributors · ODbL |
| Images | EOX Sentinel-2 cloudless 2016 · CC BY 4.0; Wikimedia Commons |
Every figure is an average or a count from a public dataset. Licences and methods: data sources.